Just upgraded from 2 to 3, I did a server wipe and a clean install of Ubuntu 22.04 than ran the CURL BlueCherry install.
I am running in a Proxmox VM cluster with the VM Specs:
64gig mem
16 cores (Host CPU)
32 gig boot with a 3T video storage disc attached
First I am having the [Could not connect: [111 ] Connection refused] issue every reboot, but it does correct the issue if I restart the service.
Second the Live view will not hold the camera layout every time I either load the page or refresh the page I have to redo the layout and camera selection.
Third the Camera feeds in the live view will just stop at random and I have to reselect the camera as reloading the page will wipe out the layout.
Since it doesn’t seem possible to use the web view I tried to use the Client, and it does work, but the Video quality is so low that its not really suitable for monitoring on a large format monitor, not sure if I am just missing something in the client setup to control quality but I am running 4k Camera’s and I can barely make out items moving around the view point area.
Thanks!
-Dustin T
1 Like
Regarding the live view in the client, by default the client uses the sub stream of the camera to reduce bandwidth and cpu usage. You can go into each camera and change the resolution of the secondary / sub stream to a higher resolution.
can the client be changed to you the main stream? the sub stream on these camera’s are just really low and I don’t have an option to match the quality of the main stream
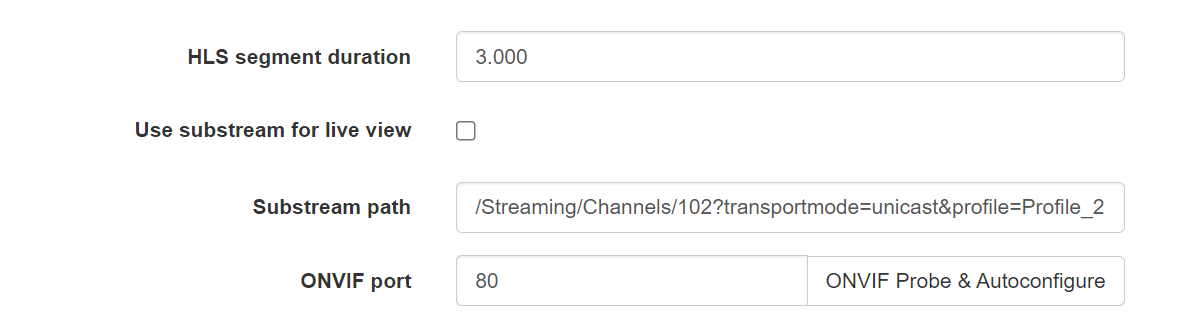
You can disable the ‘use substream for live view’ in the Bluecherry admin / devices page:
Yea that check box is already unchecked, could I replace the substream path with the main stream?
You can, however if the box is unchecked we should only use the main stream. Can you try switching to the main stream in the sub stream and see if that resolves the issue?
doesn’t make any change, just noticed I don’t think the Client is even using the Sub view when I look at the Camera’s sub view I can make out the time stamp and other labels and the sub view is visibly squished as its lower bits.
Camera Sub stream Live view

BlueCherry Client view

BlueCherry Web live View

The next time this happen can you attach the output of these:
The next time this happens can you run:
cat /proc/meminfo
free
vmstat
and a screenshot or output of ‘htop’ (preferred method below):
sudo apt install htop aha html2text
echo q | htop -C | aha --line-fix | html2text -width 999 | grep -v “F1Help” | grep -v “xml version=” > file.txt
Ok, can you try the latest (beta) of the Version 3 client to see if the resolution issue is better, the same, or worse?
sorry to take so long getting back to you I had to resolve a failed hardware issue. so first the new client had no effect on the image quality still the same as before.
on the web side I noticed a new RC was released and so I figured I would update and see if that resolved my issues, I am not sure if I did things right I did an “apt update && apt -y upgrade && apt -y autoremove” and rebooted. the web interface is now HTTP ERROR 500 and won’t load. I can tell BlueCherry DVR is still running as the client is able to display all my camera’s.
root@bluecherry:/var/log# cat /proc/meminfo
MemTotal:       65854108 kB
MemFree:         1111528 kB
MemAvailable:   63320032 kB
Buffers:          372992 kB
Cached:         60672628 kB
SwapCached:           24 kB
Active:           842408 kB
Inactive:       61530892 kB
Active(anon):       1528 kB
Inactive(anon):  1331596 kB
Active(file):     840880 kB
Inactive(file): 60199296 kB
Unevictable:       27980 kB
Mlocked:           27980 kB
SwapTotal:       7041020 kB
SwapFree:        7038436 kB
Dirty:             93080 kB
Writeback:             0 kB
AnonPages:       1356016 kB
Mapped:           218512 kB
Shmem:              6660 kB
KReclaimable:    1894472 kB
Slab:            2162848 kB
SReclaimable:    1894472 kB
SUnreclaim:       268376 kB
KernelStack:        6736 kB
PageTables:         8836 kB
NFS_Unstable:          0 kB
Bounce:                0 kB
WritebackTmp:          0 kB
CommitLimit:    39968072 kB
Committed_AS:    2197012 kB
VmallocTotal:   34359738367 kB
VmallocUsed:       28460 kB
VmallocChunk:          0 kB
Percpu:            10432 kB
HardwareCorrupted:     0 kB
AnonHugePages:         0 kB
ShmemHugePages:        0 kB
ShmemPmdMapped:        0 kB
FileHugePages:         0 kB
FilePmdMapped:         0 kB
HugePages_Total:       0
HugePages_Free:        0
HugePages_Rsvd:        0
HugePages_Surp:        0
Hugepagesize:       2048 kB
Hugetlb:               0 kB
DirectMap4k:      362360 kB
DirectMap2M:    26900480 kB
DirectMap1G:    41943040 kB

root@bluecherry:/var/log# free
               total        used        free      shared  buff/cache   available
Mem:        65854108     1818844     1080640        6660    62954624    63303656
Swap:        7041020        2584     7038436

root@bluecherry:/var/log# vmstat
procs -----------memory---------- ---swap-- -----io---- -system-- ------cpu-----
 r  b   swpd   free   buff  cache   si   so    bi    bo   in   cs us sy id wa st
 6  0   2584 1047552 373264 62607916    0    0     1   171   43   17 41  2 57  0  0

    0[                                      0.0%]   4[####################################100.0%]     8[************************************100.0%]  12[                                      0.0%]
    1[                                      0.0%]   5[                                      0.0%]     9[                                      0.0%]  13[                                      0.0%]
    2[                                      0.0%]   6[                                      0.0%]    10[                                      0.0%]  14[                                      0.0%]
    3[                                      0.0%]   7[                                      0.0%]    11[                                      0.0%]  15[####################################100.0%]
  Mem[|||#***************************************************************************1.75G/62.8G]   Tasks: 62, 147 thr; 4 running
  Swp[|                                                                              2.77M/6.71G]   Load average: 7.21 6.92 6.87
                                                                                                    Uptime: 17:09:48
    PID USER      PRI  NI  VIRT   RES   SHR S CPU%â½MEM%   TIME+  Command
   7816 bluecherr  20   0 3639M  853M 40808 S 1066  1.3 86h43:37 /usr/sbin/bc-server -s
  26240 root20   0  9132  5380  3612 R 266.  0.0  0:00.04 htop -C
   7828 bluecherr  20   0 3639M  853M 40808 S 133.  1.3  1:11.00 /usr/sbin/bc-server -s
   7841 bluecherr  20   0 3639M  853M 40808 R 133.  1.3 10h27:57 /usr/sbin/bc-server -s
   7845 bluecherr  20   0 3639M  853M 40808 S 133.  1.3 10h31:45 /usr/sbin/bc-server -s
   7850 bluecherr  20   0 3639M  853M 40808 R 133.  1.3 10h39:32 /usr/sbin/bc-server -s
   7857 bluecherr  20   0 3639M  853M 40808 S 133.  1.3  1h19:33 /usr/sbin/bc-server -s
   7871 bluecherr  20   0 3639M  853M 40808 R 133.  1.3 10h59:59 /usr/sbin/bc-server -s
  19699 bluecherr  20   0 3639M  853M 40808 S 133.  1.3 29:02.96 /usr/sbin/bc-server -s
      1 root20   0  163M 13012  8068 S  0.0  0.0  0:11.30 /sbin/init
    527 root19  -1  149M 84628 83468 S  0.0  0.1  0:10.85 /lib/systemd/systemd-journald
    570 rootRT   0  282M 27540  9092 S  0.0  0.0  0:06.98 /sbin/multipathd -d -s
    573 root20   0 11992  6456  4196 S  0.0  0.0  0:00.62 /lib/systemd/systemd-udevd
    587 root20   0  282M 27540  9092 S  0.0  0.0  0:00.00 /sbin/multipathd -d -s
    595 rootRT   0  282M 27540  9092 S  0.0  0.0  0:00.00 /sbin/multipathd -d -s
    597 rootRT   0  282M 27540  9092 S  0.0  0.0  0:00.00 /sbin/multipathd -d -s
    598 rootRT   0  282M 27540  9092 S  0.0  0.0  0:00.09 /sbin/multipathd -d -s
    599 rootRT   0  282M 27540  9092 S  0.0  0.0  0:04.62 /sbin/multipathd -d -s
    600 rootRT   0  282M 27540  9092 S  0.0  0.0  0:00.00 /sbin/multipathd -d -s
    817 systemd-t  20   0 89376  6472  5668 S  0.0  0.0  0:00.36 /lib/systemd/systemd-timesyncd
    829 systemd-t  20   0 89376  6472  5668 S  0.0  0.0  0:00.00 /lib/systemd/systemd-timesyncd
    867 systemd-n  20   0 16140  7992  6988 S  0.0  0.0  0:01.62 /lib/systemd/systemd-networkd
    869 systemd-r  20   0 25280 12008  8064 S  0.0  0.0  0:00.43 /lib/systemd/systemd-resolved
    881 root20   0  6912  3036  2784 S  0.0  0.0  0:00.32 /usr/sbin/cron -f -P
    883 messagebu  20   0  8880  4844  3984 S  0.0  0.0  0:05.08 @dbus-daemon --system --address=systemd: --nofork --nopidfile --systemd-activation --syslog-only
    889 root20   0 82784  3808  3428 S  0.0  0.0  0:03.82 /usr/sbin/irqbalance --foreground
    891 root20   0 32664 15032  6316 S  0.0  0.0  0:00.20 /usr/bin/python3 /usr/bin/networkd-dispatcher --run-startup-triggers
    893 root20   0  196M 18432 14792 S  0.0  0.0  0:04.76 php-fpm: master process (/etc/php/7.4/fpm/php-fpm.conf)
    894 root20   0  203M 22120 17268 S  0.0  0.0  0:04.80 php-fpm: master process (/etc/php/8.2/fpm/php-fpm.conf)
    895 root20   0  229M  6812  6180 S  0.0  0.0  0:00.06 /usr/libexec/polkitd --no-debug
    896 root20   0 80048  1840  1644 S  0.0  0.0  0:54.58 /usr/sbin/qemu-ga
    897 root20   0 82784  3808  3428 S  0.0  0.0  0:00.00 /usr/sbin/irqbalance --foreground
    898 syslog     20   0  217M  5292  4204 S  0.0  0.0  0:02.17 /usr/sbin/rsyslogd -n -iNONE
    900 root20   0 80048  1840  1644 S  0.0  0.0  0:00.00 /usr/sbin/qemu-ga
    901 root20   0 1936M 45676 20420 S  0.0  0.1  0:10.45 /usr/lib/snapd/snapd
    903 root20   0 15348  7148  6208 S  0.0  0.0  0:02.26 /lib/systemd/systemd-logind
    905 root20   0  383M 12648 10524 S  0.0  0.0  0:00.34 /usr/libexec/udisks2/udisksd
    921 root20   0  229M  6812  6180 S  0.0  0.0  0:00.00 /usr/libexec/polkitd --no-debug
    923 root20   0  229M  6812  6180 S  0.0  0.0  0:00.02 /usr/libexec/polkitd --no-debug
    924 syslog     20   0  217M  5292  4204 S  0.0  0.0  0:01.04 /usr/sbin/rsyslogd -n -iNONE
    925 syslog     20   0  217M  5292  4204 S  0.0  0.0  0:00.00 /usr/sbin/rsyslogd -n -iNONE
    926 syslog     20   0  217M  5292  4204 S  0.0  0.0  0:01.07 /usr/sbin/rsyslogd -n -iNONE
    927 root20   0  238M 12156 10272 S  0.0  0.0  0:00.21 /usr/sbin/ModemManager
    928 root20   0  6172  1088  1000 S  0.0  0.0  0:00.01 /sbin/agetty -o -p -- \u --noclear tty1 linux
    935 root20   0  107M 17652  9424 S  0.0  0.0  0:00.18 /usr/bin/python3 /usr/share/unattended-upgrades/unattended-upgrade-shutdown --wait-for-signal
    938 root20   0  238M 12156 10272 S  0.0  0.0  0:00.00 /usr/sbin/ModemManager
    940 root20   0  238M 12156 10272 S  0.0  0.0  0:00.00 /usr/sbin/ModemManager
    945 root20   0  383M 12648 10524 S  0.0  0.0  0:00.00 /usr/libexec/udisks2/udisksd
    947 root20   0  383M 12648 10524 S  0.0  0.0  0:00.01 /usr/libexec/udisks2/udisksd
Ok so I was reading some one else was having an install issue and you gave them some packages to install, and I noticed I didn’t see any php processes running so I gave that a try
sudo apt-get install php7.4-fpm php7.4-sqlite3 php7.4-curl php7.4-mysql php7.4-gd php-mail php-mail-mime-php-mysql php7.4-fpm php7.4-mysql
note php-mail-mime-php-mysql was not found so I removed it and reran the install, that seemed to correct the issue and the web site is now loading. So I will watch and see if the feeds stop with this never RC.
DT
Ok so watching it today and 5 of 6 feeds have stopped
root@bluecherry:/home/dustin# cat /proc/meminfo
MemTotal:       65854108 kB
MemFree:        21107092 kB
MemAvailable:   63340928 kB
Buffers:          243548 kB
Cached:         41524644 kB
SwapCached:            0 kB
Active:           499360 kB
Inactive:       42622544 kB
Active(anon):       1168 kB
Inactive(anon):  1365776 kB
Active(file):     498192 kB
Inactive(file): 41256768 kB
Unevictable:       27980 kB
Mlocked:           27980 kB
SwapTotal:       7041020 kB
SwapFree:        7041020 kB
Dirty:             69340 kB
Writeback:             0 kB
AnonPages:       1381996 kB
Mapped:           201332 kB
Shmem:              6884 kB
KReclaimable:    1205020 kB
Slab:            1407496 kB
SReclaimable:    1205020 kB
SUnreclaim:       202476 kB
KernelStack:        6512 kB
PageTables:         8816 kB
NFS_Unstable:          0 kB
Bounce:                0 kB
WritebackTmp:          0 kB
CommitLimit:    39968072 kB
Committed_AS:    2143080 kB
VmallocTotal:   34359738367 kB
VmallocUsed:       27876 kB
VmallocChunk:          0 kB
Percpu:            10688 kB
HardwareCorrupted:     0 kB
AnonHugePages:         0 kB
ShmemHugePages:        0 kB
ShmemPmdMapped:        0 kB
FileHugePages:         0 kB
FilePmdMapped:         0 kB
HugePages_Total:       0
HugePages_Free:        0
HugePages_Rsvd:        0
HugePages_Surp:        0
Hugepagesize:       2048 kB
Hugetlb:               0 kB
DirectMap4k:      214904 kB
DirectMap2M:     9222144 kB
DirectMap1G:    59768832 kB
root@bluecherry:/home/dustin# free
               total        used        free      shared  buff/cache   available
Mem:        65854108     1771168    21064144        6884    43018796    63343424
Swap:        7041020           0     7041020
root@bluecherry:/home/dustin# vmstat
procs -----------memory---------- ---swap-- -----io---- -system-- ------cpu-----
 r  b   swpd   free   buff  cache   si   so    bi    bo   in   cs us sy id wa st
21  0      0 21032036 243620 42810252    0    0    16   207  160   19 40  2 58  0  0

    0[                                      0.0%]   4[####################################100.0%]     8[####################################100.0%]  12[                                      0.0%]
    1[                                      0.0%]   5[####################################100.0%]     9[####################################100.0%]  13[                                      0.0%]
    2[                                      0.0%]   6[#####################***************100.0%]    10[####################################100.0%]  14[                                      0.0%]
    3[                                      0.0%]   7[                                      0.0%]    11[#####################                50.0%]  15[                                      0.0%]
  Mem[|||#************************************************************               1.68G/62.8G]   Tasks: 60, 136 thr; 8 running
  Swp[                                                                                  0K/6.71G]   Load average: 6.19 6.74 6.94
                                                                                                    Uptime: 03:36:52
    PID USER      PRI  NI  VIRT   RES   SHR S CPU%â½MEM%   TIME+  Command
  14671 bluecherr  20   0 3463M  891M 44160 S 834.  1.4 23h47:39 /usr/sbin/bc-server -s
  14737 bluecherr  20   0 3463M  891M 44160 R 208.  1.4  2h53:53 /usr/sbin/bc-server -s
  14731 bluecherr  20   0 3463M  891M 44160 R 139.  1.4  2h51:10 /usr/sbin/bc-server -s
  14734 bluecherr  20   0 3463M  891M 44160 R 139.  1.4  2h52:20 /usr/sbin/bc-server -s
  14814 bluecherr  20   0 3463M  891M 44160 R 139.  1.4  2h50:18 /usr/sbin/bc-server -s
  14820 bluecherr  20   0 3463M  891M 44160 R 139.  1.4  3h00:45 /usr/sbin/bc-server -s
  14746 bluecherr  20   0 3463M  891M 44160 S 69.6  1.4 22:19.63 /usr/sbin/bc-server -s
  14747 bluecherr  20   0 3463M  891M 44160 S 69.6  1.4 22:23.69 /usr/sbin/bc-server -s
  19789 root20   0  9140  5408  3648 R 69.6  0.0  0:00.06 htop -C
      1 root20   0  163M 13008  8176 S  0.0  0.0  0:04.52 /sbin/init
    529 root19  -1  117M 61304 60144 S  0.0  0.1  0:03.04 /lib/systemd/systemd-journald
    576 rootRT   0  282M 27540  9092 S  0.0  0.0  0:01.54 /sbin/multipathd -d -s
    579 root20   0 12544  7220  4416 S  0.0  0.0  0:00.59 /lib/systemd/systemd-udevd
    580 root20   0  282M 27540  9092 S  0.0  0.0  0:00.00 /sbin/multipathd -d -s
    582 rootRT   0  282M 27540  9092 S  0.0  0.0  0:00.00 /sbin/multipathd -d -s
    583 rootRT   0  282M 27540  9092 S  0.0  0.0  0:00.00 /sbin/multipathd -d -s
    584 rootRT   0  282M 27540  9092 S  0.0  0.0  0:00.02 /sbin/multipathd -d -s
    585 rootRT   0  282M 27540  9092 S  0.0  0.0  0:00.97 /sbin/multipathd -d -s
    586 rootRT   0  282M 27540  9092 S  0.0  0.0  0:00.00 /sbin/multipathd -d -s
    826 systemd-t  20   0 89376  6468  5664 S  0.0  0.0  0:00.20 /lib/systemd/systemd-timesyncd
    836 systemd-t  20   0 89376  6468  5664 S  0.0  0.0  0:00.00 /lib/systemd/systemd-timesyncd
    875 systemd-n  20   0 16140  8220  7228 S  0.0  0.0  0:00.38 /lib/systemd/systemd-networkd
    877 systemd-r  20   0 25280 12528  8592 S  0.0  0.0  0:00.26 /lib/systemd/systemd-resolved
    888 root20   0  6912  2884  2636 S  0.0  0.0  0:00.17 /usr/sbin/cron -f -P
    889 messagebu  20   0  8780  4904  4084 S  0.0  0.0  0:01.19 @dbus-daemon --system --address=systemd: --nofork --nopidfile --systemd-activation --syslog-only
    894 root20   0 82784  3832  3452 S  0.0  0.0  0:00.80 /usr/sbin/irqbalance --foreground
    896 root20   0 32664 19144 10428 S  0.0  0.0  0:00.19 /usr/bin/python3 /usr/bin/networkd-dispatcher --run-startup-triggers
    901 root20   0  229M  6872  6244 S  0.0  0.0  0:00.04 /usr/libexec/polkitd --no-debug
    902 root20   0 80048  1832  1640 S  0.0  0.0  0:11.13 /usr/sbin/qemu-ga
    903 syslog     20   0  217M  5768  4416 S  0.0  0.0  0:00.66 /usr/sbin/rsyslogd -n -iNONE
    905 root20   0 1864M 34628 18736 S  0.0  0.1  0:06.35 /usr/lib/snapd/snapd
    908 root20   0 82784  3832  3452 S  0.0  0.0  0:00.00 /usr/sbin/irqbalance --foreground
    909 root20   0 15348  7388  6444 S  0.0  0.0  0:00.63 /lib/systemd/systemd-logind
    911 root20   0  383M 12632 10496 S  0.0  0.0  0:00.20 /usr/libexec/udisks2/udisksd
    917 root20   0  6172  1108  1020 S  0.0  0.0  0:00.01 /sbin/agetty -o -p -- \u --noclear tty1 linux
    918 root20   0  229M  6872  6244 S  0.0  0.0  0:00.00 /usr/libexec/polkitd --no-debug
    926 syslog     20   0  217M  5768  4416 S  0.0  0.0  0:00.32 /usr/sbin/rsyslogd -n -iNONE
    927 syslog     20   0  217M  5768  4416 S  0.0  0.0  0:00.00 /usr/sbin/rsyslogd -n -iNONE
    928 syslog     20   0  217M  5768  4416 S  0.0  0.0  0:00.30 /usr/sbin/rsyslogd -n -iNONE
    937 root20   0 80048  1832  1640 S  0.0  0.0  0:00.00 /usr/sbin/qemu-ga
    947 root20   0  383M 12632 10496 S  0.0  0.0  0:00.00 /usr/libexec/udisks2/udisksd
    950 root20   0  229M  6872  6244 S  0.0  0.0  0:00.01 /usr/libexec/polkitd --no-debug
    951 root20   0  383M 12632 10496 S  0.0  0.0  0:00.00 /usr/libexec/udisks2/udisksd
    952 root20   0  107M 21540 13324 S  0.0  0.0  0:00.18 /usr/bin/python3 /usr/share/unattended-upgrades/unattended-upgrade-shutdown --wait-for-signal
    954 root20   0  238M 11988 10108 S  0.0  0.0  0:00.19 /usr/sbin/ModemManager
    957 root20   0 15444  8828  7256 S  0.0  0.0  0:00.02 sshd: /usr/sbin/sshd -D [listener] 0 of 10-100 startups
    954 root20   0  238M 11988 10108 S  0.0  0.0  0:00.19 /usr/sbin/ModemManager
    957 root20   0 15444  8828  7256 S  0.0  0.0  0:00.02 sshd: /usr/sbin/sshd -D [listener] 0 of 10-100 startups
    963 root20   0  238M 11988 10108 S  0.0  0.0  0:00.00 /usr/sbin/ModemManager
    964 root20   0  107M 21540 13324 S  0.0  0.0  0:00.00 /usr/bin/python3 /usr/share/unattended-upgrades/unattended-upgrade-shutdown --wait-for-signal
    968 root20   0  238M 11988 10108 S  0.0  0.0  0:00.00 /usr/sbin/ModemManager
Can you get remote access (ssh) to this server? If so please PM the details.